- 是加工定制
- ly品牌
- 否是否跨境货源
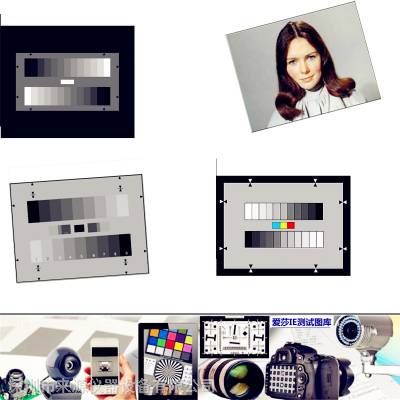
测试卡展示
测试卡说明
混叠效应是由两个光栅的干涉引起的莫尔扭曲。独立于相机类型,混叠效应可能由于动态光栅和TV线结构的干扰而产生众所周知的百叶帘效应或纺织条纹图案。
TE194由8行矩形条组成,空间频率为1,2,4,6,8,10,12和14MHz。调整奇数频率值从3到13,图像必须按照测试卡上边缘和下边缘上的相应标记(箭头)的限制方式放大。然后频率指每个具有下一较低偶数频率的行。可以使用频谱分析仪或宽带视频示波器进行测量程序。
Aliasing effects are moiré distortions caused by interferences of two rasters. Independent of the type of camera aliasing effects can arise by interferences of motive rasters and the TV line structure e.g. the well known venetian blind effect or textile stripe patterns.
CCD cameras have a special immanent aliasing problem caused by the spatial image sampling. The spectrum of the signal obtained at the camera output is compromised of a basic spectrum repeated around multiples of the CCD sampling frequency. The CCD sampling frequency depends on the CCD size and the number of the pixels per CCD width. For some high spatial frequencies of the image, the condition dictated by sampling theorem is not met, so that the basic spectrum and duplicated spectrum can be superimposed and give rise to inter-frequency beats. The result is moiré in the pictures.
Moiré visibility depends on the type of analyser, on the camera's low pass optical filtering and on the spatial frequency of the test pattern analysed.
The TE194 consists of 8 rows of rectangular bars the spatial frequencies of 1, 2, 4, 6, 8, 10, 12 and 14MHz. To adjust the odd frequency values 3 to 13 the picture has to be zoomed in a way that it is limited by the respective markings (arrows) on the upper and bottom edge of the test chart. The frequency then refers to the row with the next lower even frequency each.
Measurement procedures can be made with a spectrum analyser or a wide-band video oscilloscope.
Measurement conditions
Gamma correction: OFF
Contour correction: OFF
olor correction: ON
Spectrum analysers measurements
The measurement principle consists in locating, on the spectral analyses of the luminance signal Y or coded Y, and successively R, G, B; the interference lines resulting from sampling. The camera is aligned on the test chart at a given spatial frequency. The camera output is connected with the input of a spectrum analyser. The iris is adjusted so, that the white level corresponds to a vision signal of 700mV / 75 Ohms. The pedestral is set at 0 mV. In case of the analyses of a signal including mixed sync pulses, it is recommended that these pulses, which render interpretation of the spectrum analyser curves more difficult, be suppressed.
A measurement example is given in figure 2 below.
If the number of horizontal CCD pixels is known, it is possible to calculate the sampling frequency, which is easily located on the analysers screen:
Sampling F (MHz) = No. of horizontal pixels / 52
The frequency of the interference line is given by the difference between the sampling frequency and the test pattern frequency:
Interference F = Sampling F – test pattern F
The measurement involves determine the difference in level between the useful signal (s) at test pattern frequency and the signal at interference frequency. The measurements have to be repeated for each of the spatial frequencies and made several times (approx. 10 times) to determine an average result.
 在线问
在线问
- 是
- ly
- 否


